We could readily build a set of them for teachers willing to engage classes on the realities of climate and/or of pressure groups and their mentors. The recent splattergate movie from 10:10 is a reminder of how zealotry, and the ignoring of real data, can so easily lead to ruthless fanaticism. Using simple data sets can be enough to expose, bit by bit, step by step, the emptiness of the fanatics' approach, and at the same time encourage youngsters to discuss, differ, and think for themselves in a civilised manner.
Steven Goddard's blog has some suitable material today which could readily be built-up into a '10-minute trainer', looking at a doom-laden prediction about sea levels around New York city - a prediction made by leading CO2-agitator, James Hansen in 1988 for the year 2008: (http://stevengoddard.wordpress.com/2010/10/04/correlating-new-york-sea-level-rise-with-co2/):
(1) The predictions (source:http://dir.salon.com/books/int/2001/10/23/weather/index.html) :
'While doing research 12 or 13 years ago, I met Jim Hansen, the scientist who in 1988 predicted the greenhouse effect before Congress. I went over to the window with him and looked out on Broadway in New York City and said, "If what you're saying about the greenhouse effect is true, is anything going to look different down there in 20 years?" He looked for a while and was quiet and didn't say anything for a couple seconds. Then he said, "Well, there will be more traffic." I, of course, didn't think he heard the question right. Then he explained, "The West Side Highway [which runs along the Hudson River] will be under water. And there will be tape across the windows across the street because of high winds. And the same birds won't be there. The trees in the median strip will change." Then he said, "There will be more police cars." Why? "Well, you know what happens to crime when the heat goes up." '
(2) The data (source: http://tidesandcurrents.noaa.gov/sltrends/50yr.shtml?stnid=8518750&name=The+Battery&state=New+York): a scatterplot of the rate of sea-level rise (in mm per year) against CO2 concentration
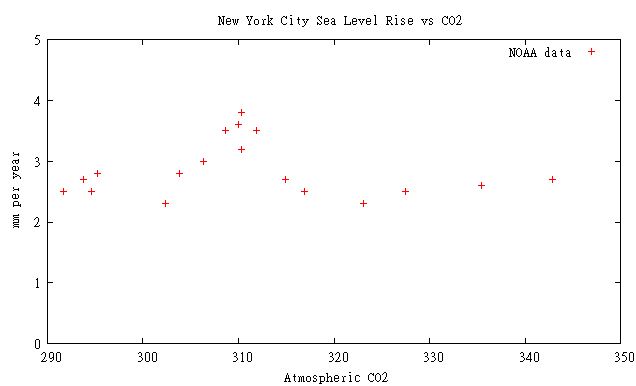
And of course, now in 2010, 22 years after Hansen's casual (and causal) talk of sea-level rises bringing flooding to New York in 20 years thanks to the 'greenhouse effect' [of CO2], we can easily confirm that it has not yet happened - the West Side Highway is not under water due to higher sea-levels.

(3) Another plot:

(Source: http://stevengoddard.wordpress.com/2010/10/04/the-rumours-of-manhattans-death-are-exaggerated/)
Now class, what can we learn from this? What other data from New York or elsewhere do you think would be helpful to improve our discussion of these predictions? How far would you be willing to extrapolate from a such a scatterplot using higher levels of CO2? Do you think CO2 levels could ever be a reliable predictor of sea level changes? What would a naive extrapolation of the plot predict for the rate of sea level rise today given that CO2 levels have risen further over the past few years? What relevance would rainfall levels or storms have to our discussion? And so on.
Note Added 5 November 2012 Last year, Hansen claimed he never made the forecast for 20 years out, but rather 40 years and the journalist misheard him. An update on the WUWT 2009 post has been made, and shows that even adding another 20 years to the alarming forecast, it still does not look at all plausible.
More analysis on Hansen's alarmism here: http://hauntingthelibrary.wordpress.com/2011/01/06/james-hansen-1986-within-15-years-temps-will-be-hotter-than-past-100000-years/
The entire Global Warming hype is based on temperature readings from badly sited thermometers. The latest post from Jo Nova includes many pictures from Anthony Watts "Surface Stations" project, and is the easiest way I can think of to show how we are all being duped.
ReplyDeletehttp://joannenova.com.au/2010/10/is-the-western-climate-establishment-corrupt-part-i/#more-10726
Have your school classes read the post, and then ask them if it changes their outlook....